REPORT: OSUN 7th Largest Economy In Nigeria – Renaissance Capital
 This exercise is an attempt to develop a greater understanding of Nigeria at state level. As we had expected, our analysis confirms that Lagos State is Nigeria’s biggest economy, producing c. 12% of the country’s national income. Post-rebasing of GDP in 2013, we expect Lagos State economy to become Africa’s 13th biggest economy at c. $45bn – equivalent to Ghana.
Households in Nigeria’s southern states are better educated and have smaller household sizes. States that cluster around key commercial states also benefit from externalities. In the SW where Lagos State has the highest per-capita income, Oyo and Osun States also score highly.
Consumer companies are likely to find the greatest opportunities in states with greater purchasing power, as indicted by relatively high per capita income, including Lagos, the FCT Abuja, as well as Oyo, Osun in the SW and Kaduna and Nassarawa (both next to the FCT Abuja), and the Niger Delta states. We see opportunities for banks to expand services and employees into states that have a combination of high income and population densities, as that will provide the footfall required to open a bank branch. States that fit this profile are Anambra, Imo and Abia in the SE region; Akwa Ibom and Rivers in the Niger Delta region; and Osun in the SW.
Below is the Socioeconomic profile of Nigeria’s states
| Figure 38: Socioeconomic profile of Nigeria’s states States | GDP, $bn (2012E) | % of Nigeria’s GDP | Population , mn (2012E) | % of Nigeria’s population | GDP per capita, $ (2012E) | Net secondary school attendance rate, ratio (2007) |
| Lagos | 31.2 | 11.4 | 10.7 | 6.5 | 2,916 | 85 |
| Kano | 16.8 | 6.2 | 11.0 | 6.7 | 1,525 | 28 |
| Oyo | 14.2 | 5.2 | 6.5 | 4.0 | 2,165 | 71 |
| Kaduna | 13.3 | 4.9 | 7.2 | 4.4 | 1,860 | 49 |
| Rivers | 11.3 | 4.2 | 6.1 | 3.7 | 1,859 | 75 |
| Katsina | 10.6 | 3.9 | 6.8 | 4.1 | 1,554 | 17 |
| Osun | 9.4 | 3.5 | 4.0 | 2.4 | 2,356 | 77 |
| Imo | 9.1 | 3.3 | 4.6 | 2.8 | 1,983 | 74 |
| Anambra | 8.9 | 3.3 | 4.9 | 3.0 | 1,814 | 72 |
| Akwa Ibom | 8.2 | 3.0 | 4.6 | 2.8 | 1,783 | 70 |
| Borno | 8.0 | 2.9 | 4.9 | 3.0 | 1,631 | 8 |
| Bauchi | 7.8 | 2.9 | 5.5 | 3.3 | 1,432 | 5 |
| Niger | 7.6 | 2.8 | 4.6 | 2.8 | 1,631 | 56 |
| FCT Abuja | 6.8 | 2.5 | 1.6 | 1.0 | 4,094 | 67 |
| Edo | 6.7 | 2.4 | 3.8 | 2.3 | 1,756 | 70 |
| Abia | 6.3 | 2.3 | 3.4 | 2.1 | 1,855 | 79 |
| Plateau | 6.2 | 2.3 | 3.8 | 2.3 | 1,640 | 46 |
| Benue | 6.1 | 2.2 | 5.0 | 3.0 | 1,226 | 56 |
| Delta | 6.0 | 2.2 | 4.8 | 2.9 | 1,249 | 75 |
| Ondo | 5.9 | 2.2 | 4.1 | 2.5 | 1,457 | 76 |
| Zamfara | 5.7 | 2.1 | 3.8 | 2.3 | 1,492 | 18 |
| Sokoto | 5.7 | 2.1 | 4.3 | 2.6 | 1,313 | 15 |
| Enugu | 5.0 | 1.8 | 3.8 | 2.3 | 1,299 | 70 |
| Kogi | 4.8 | 1.8 | 3.9 | 2.4 | 1,235 | 74 |
| Adamawa | 4.6 | 1.7 | 3.7 | 2.3 | 1,233 | 11 |
| Nasarawa | 4.4 | 1.6 | 2.2 | 1.3 | 1,997 | 57 |
| Jigawa | 4.4 | 1.6 | 5.1 | 3.1 | 853 | 23 |
| Kebbi | 4.2 | 1.5 | 3.8 | 2.3 | 1,104 | 21 |
| Cross River | 4.2 | 1.5 | 3.4 | 2.1 | 1,242 | 71 |
| Ekiti | 4.2 | 1.5 | 2.8 | 1.7 | 1,495 | 85 |
| Ogun | 4.2 | 1.5 | 4.4 | 2.7 | 952 | 75 |
| Kwara | 4.0 | 1.5 | 2.8 | 1.7 | 1,454 | 70 |
| Taraba | 3.9 | 1.4 | 2.7 | 1.6 | 1,444 | 6 |
| Bayelsa | 3.6 | 1.3 | 2.0 | 1.2 | 1,816 | 74 |
| Ebonyi | 3.6 | 1.3 | 2.6 | 1.6 | 1,400 | 56 |
| Yobe | 3.3 | 1.2 | 2.7 | 1.7 | 1,207 | 7 |
| Gombe | 2.9 | 1.1 | 2.8 | 1.7 | 1,041 | 16 |
| Source: National Bureau of Statistics, National Population Commission, Renaissance Capital estimates |
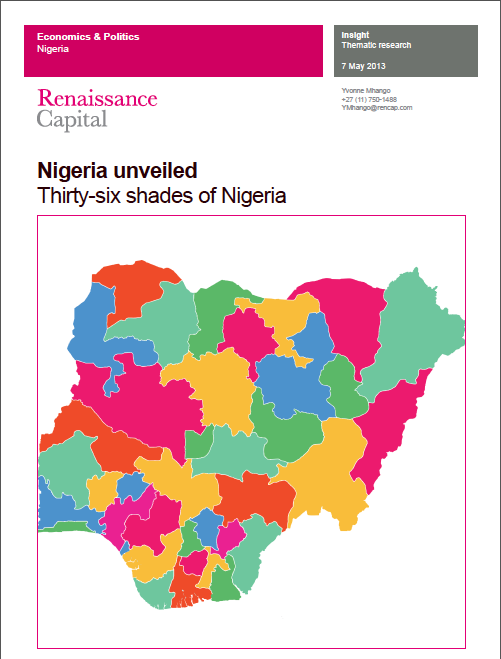
 Read/Download full report here Renaissance capital 36 shades of Nigeira
